Can We Put a Number on "Related"?
In the last post, I made a scatter plot.
Run differential on the X-axis, winning percentage on the Y-axis. The dots ran from bottom-left to top-right. The feeling was clear: "these are related."
But that's just a feeling.
"Looks related" means different things to different people. One person sees a strong trend, another sees too much scatter. Same chart, different conclusions.
Can we express how strong this relationship is with a single number?
The limits of looking
Imagine comparing two scatter plots:
- A: dots sit almost perfectly on a straight line
- B: dots trend upward, but they're pretty spread out
You can tell A shows a "stronger" relationship. But you can't answer:
- How much stronger is A than B?
- Is B's relationship "weak" or "moderate"?
- Does this relationship get stronger or weaker across seasons?
To compare, track, and judge, you need numbers.
A Number Called r
There's a number for exactly this. The correlation coefficient, usually written as r.
Skipping the formula, here's what matters:
- r = 1 → dots form a perfect upward line. One goes up, the other always goes up too.
- r = -1 → perfect downward line. One goes up, the other always goes down.
- r = 0 → no straight-line relationship. (A curved relationship can still have r near 0.)
In reality, r is rarely exactly 1 or 0. It falls somewhere in between. So we need a scale. Here's one common one — conventions vary by field, and negative values are read by absolute value:
| r value (absolute) | Interpretation |
|---|---|
| 0.9+ | Very strong |
| 0.7 – 0.9 | Strong |
| 0.4 – 0.7 | Moderate |
| 0.2 – 0.4 | Weak |
| Below 0.2 | Negligible |
So What's the r for Run Differential vs. Win%?
I calculated it with 2025 MLB data — all 30 teams.
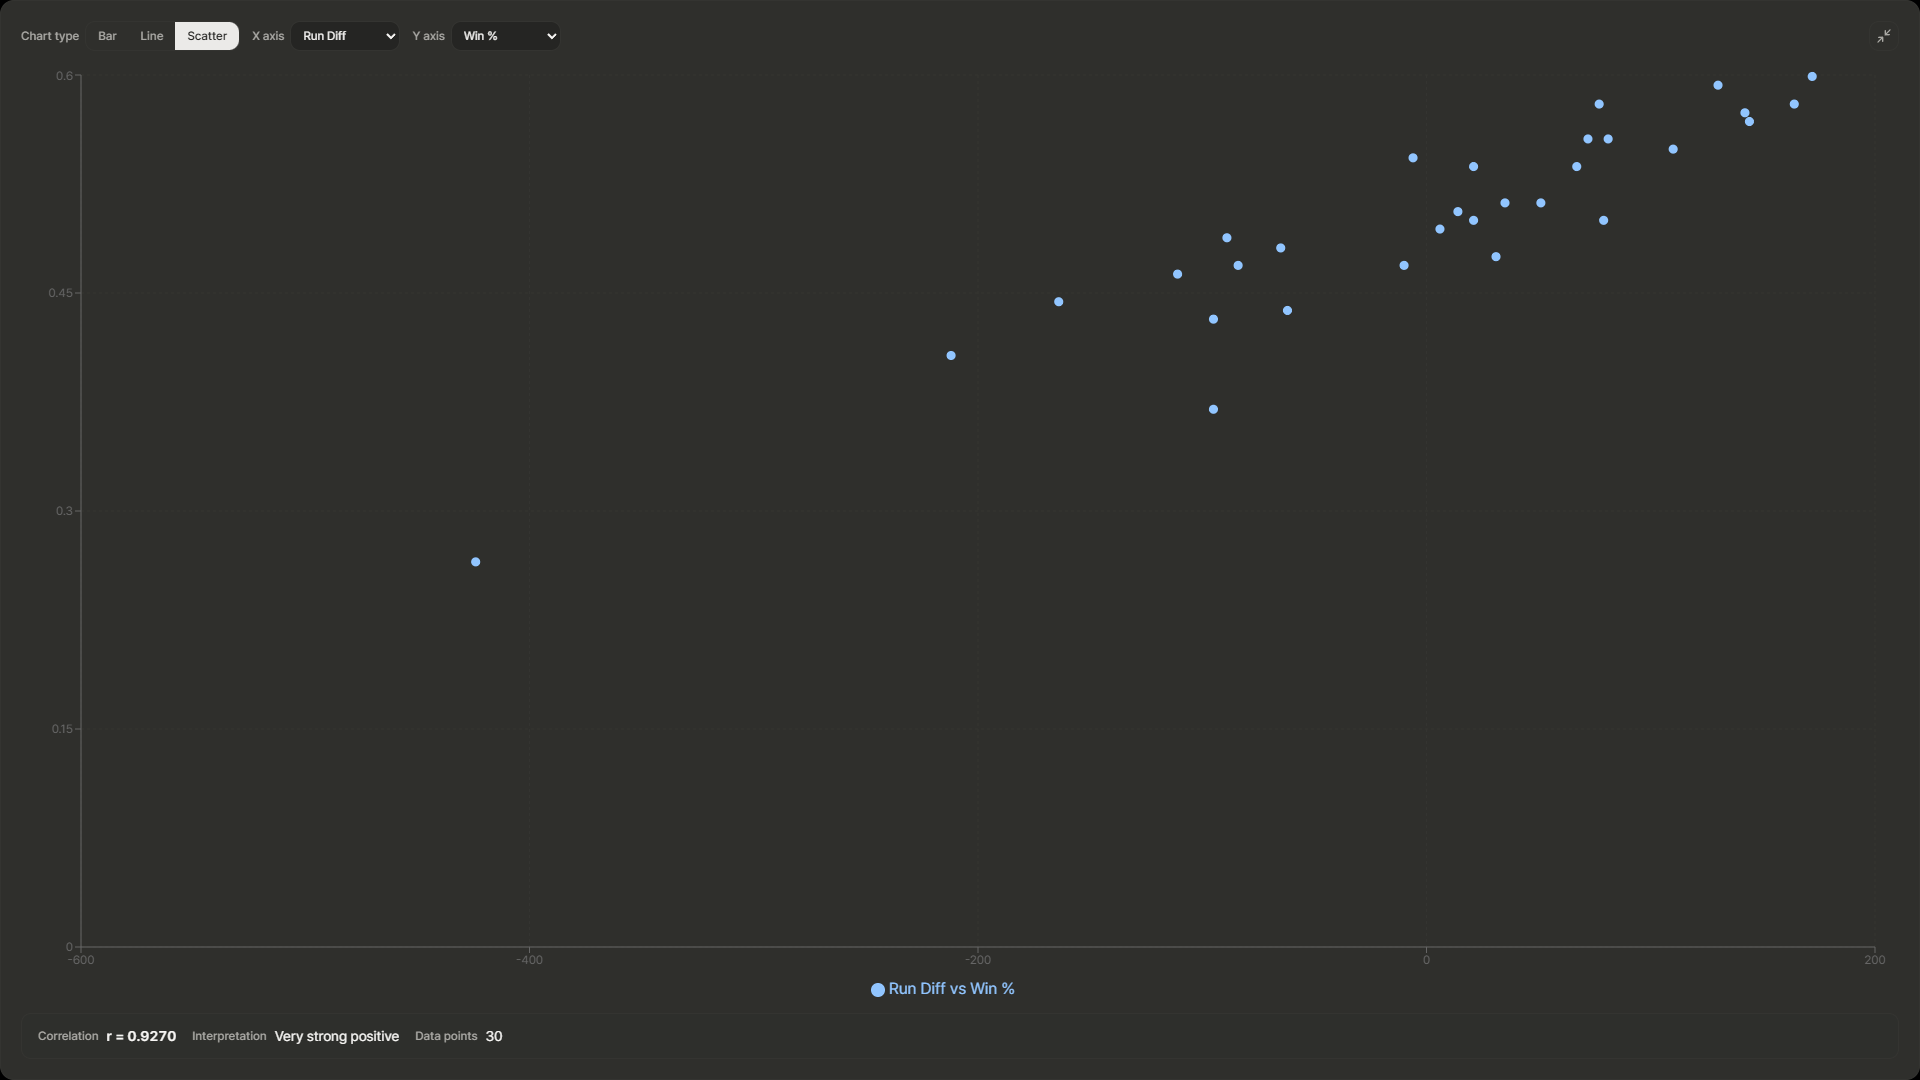
Result:
r = 0.927 — Very strong positive correlation
Fairly close to 1.
The feeling from the scatter plot was right, and the relationship is very strong. Teams with a big run differential mostly have a high winning percentage.
What About Other Combinations?
Is it only run differential that correlates strongly with winning percentage?
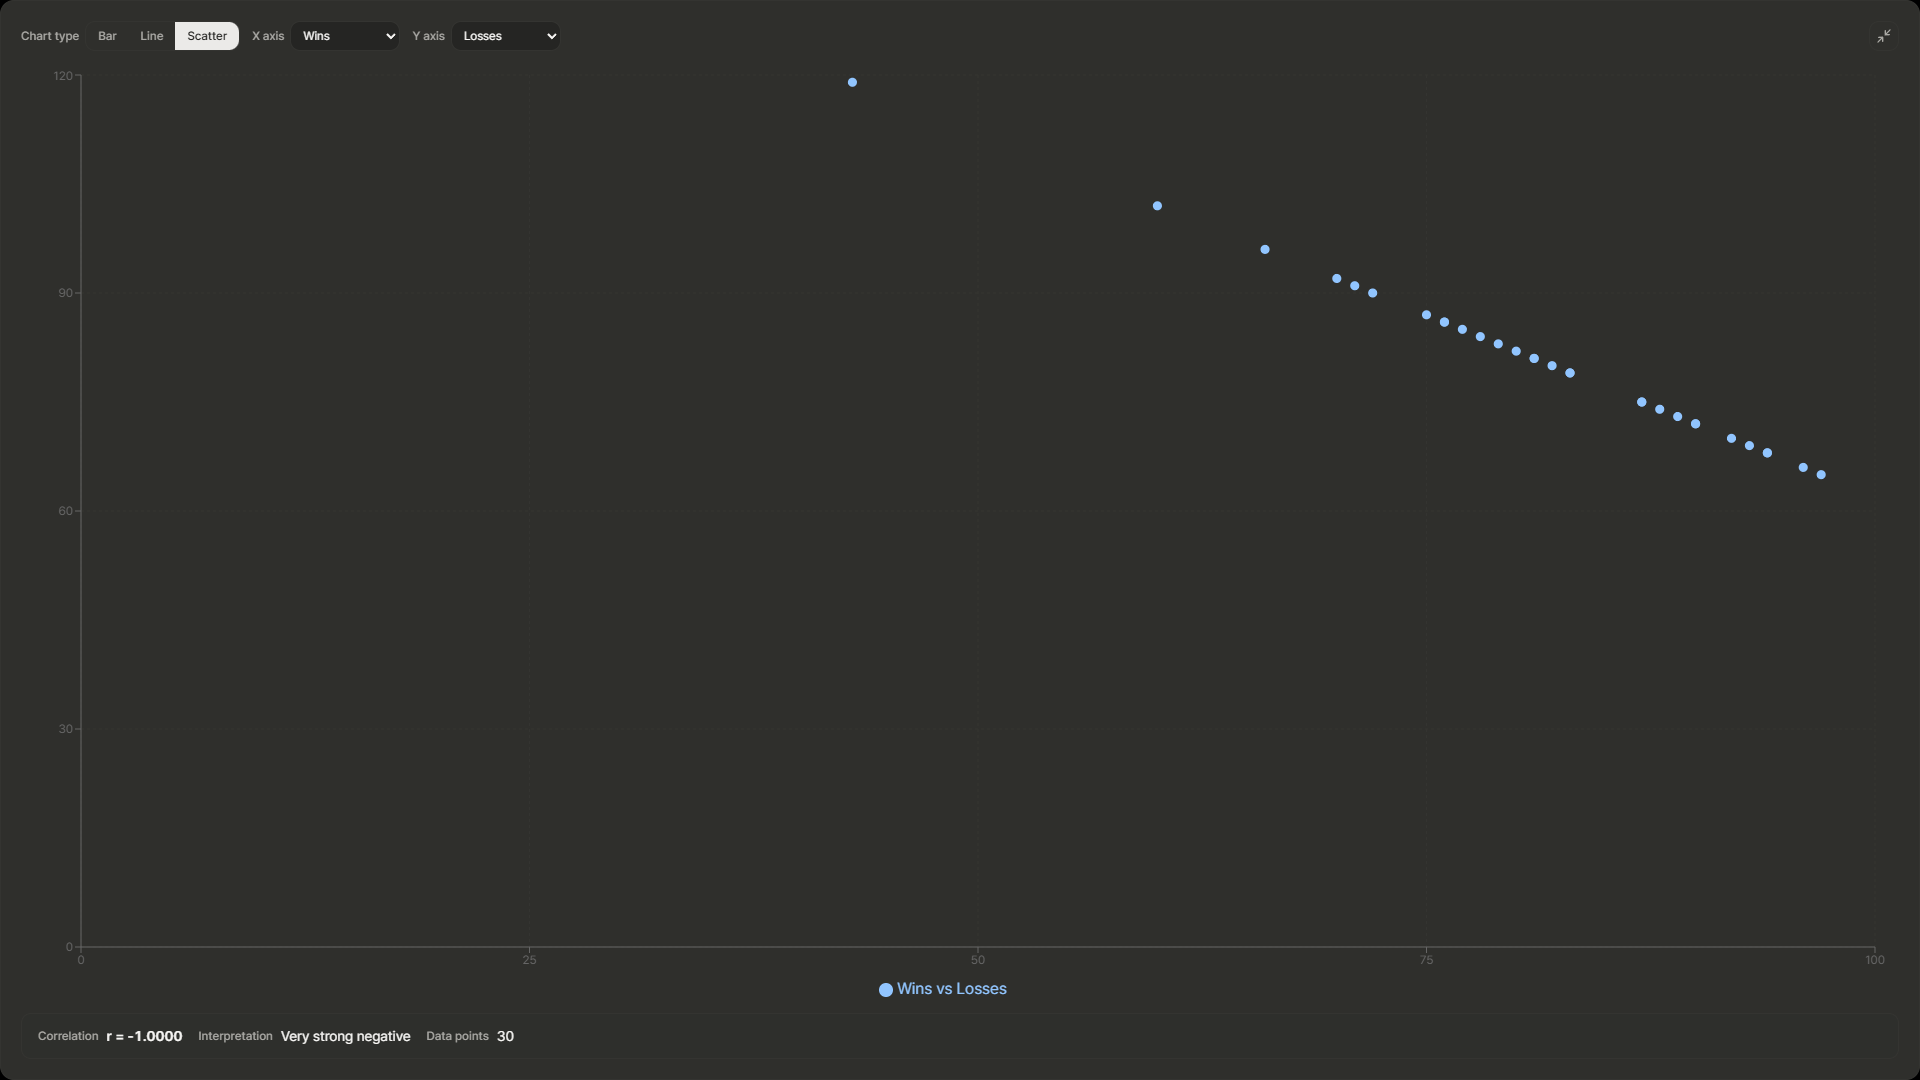
- Wins (W) vs. Losses (L): r = −1.0. Every team played 162 games in 2025, so wins plus losses always equals 162, and the points sit exactly on a line.
- Runs Scored (R) vs. Win% (Pct): r in the 0.7–0.8 range. Scoring runs matters, but not as much as run differential.
Run differential explains winning percentage better than runs scored alone. Looking at the gap between offense and defense explains wins better, and the numbers confirm it.
But Is 30 Teams Enough?
Here's the nagging question.
We only have 30 data points. One season, 30 teams. Would r still be this high for the 2024 season? For 2023?
Drawing a strong conclusion from 30 points feels a bit premature. Maybe 2025 is just an outlier year.
We need more data to be sure.
→ In the next post, I'll combine multiple seasons and check whether this relationship holds year after year — or if it shows up in only one season.
This analysis was done with just-mlb, a tool I built. Want to see the correlation coefficient on the scatter plot yourself? Check it out.

