Was That August Tear Real? Win Streaks and the "Luck Scenario" Yardstick
At the end of the last post, I left this question.
What about within a season? That team "winning like crazy in August" — is the hot streak real, or is that luck too? A coin comes up heads 7 times in a row; how is a baseball team's August tear any different?
The one-line summary of this post:
Barely different. Over 162 games, even a momentum-free coin runs off 7–8 wins in a row almost every season. Our eyes just attach a story — "they got hot" — to that random cluster.
First: how do we even decide if it's real?
Last time we looked at luck between seasons. About 87% of this year's residual vanished by next year — luck regressed to the mean.
Now it's within one season. When a team wins 9 straight in August, we say they "caught fire," they're "on a run." But how would we show that's real? More fundamentally — what does "real" even mean here?
This is where the single most important habit in data analysis shows up. To judge whether a pattern means anything, you first have to know what the data would look like if nothing had happened at all. That "nothing happening" world is your baseline. If the real data is indistinguishable from it, the pattern you saw was an illusion.
Statistics calls this baseline a null model. The name is stiff but the idea is simple. In our case we build it like this:
Replace a team's season with a biased coin that wins each game with the same fixed probability p. No momentum, no memory. Winning yesterday doesn't make it flip better today. p is the win rate that team actually posted that season.
Let's call this fake coin season the "luck scenario" — "if this had all been luck, here's how the data would look."
Run the luck scenario thousands of times
Take the 2024 Yankees. 94–68, a .580 team, and they won 8 straight in August. "Yankees are red hot," went the headlines.
Now turn the Yankees into the luck scenario: a coin that still wins 58% but has zero momentum. Run a 162-game season with that coin 20,000 times, and count the longest win streak each season. Then ask — what fraction of those momentum-free seasons produce an 8-game streak or longer?
The answer is 58%. A no-momentum coin runs off 8+ wins in more than half its seasons. The Yankees' 8-game streak was nothing special. It's something a coin does routinely.
Let's call this number — "the chance the luck scenario produces a streak this long or longer" — the luck %. Higher means an ordinary streak (well explained by luck); lower means a streak that's hard to explain with a coin.
Even all-time great teams look similar. The 2022 Dodgers were a 111-win monster and won 12 straight — and even that 12-game streak has a luck % of 41%. A coin with the same win rate does it 4 times out of 10.
A picture: put the real team and the coin side by side
One streak length isn't the whole story. Look at the season's full arc. Compute the last-10-games win rate (wins in the trailing 10) at every game and connect them, and you get a curve that rises and falls all season. An August tear shows up as a stretch where this curve spikes up.
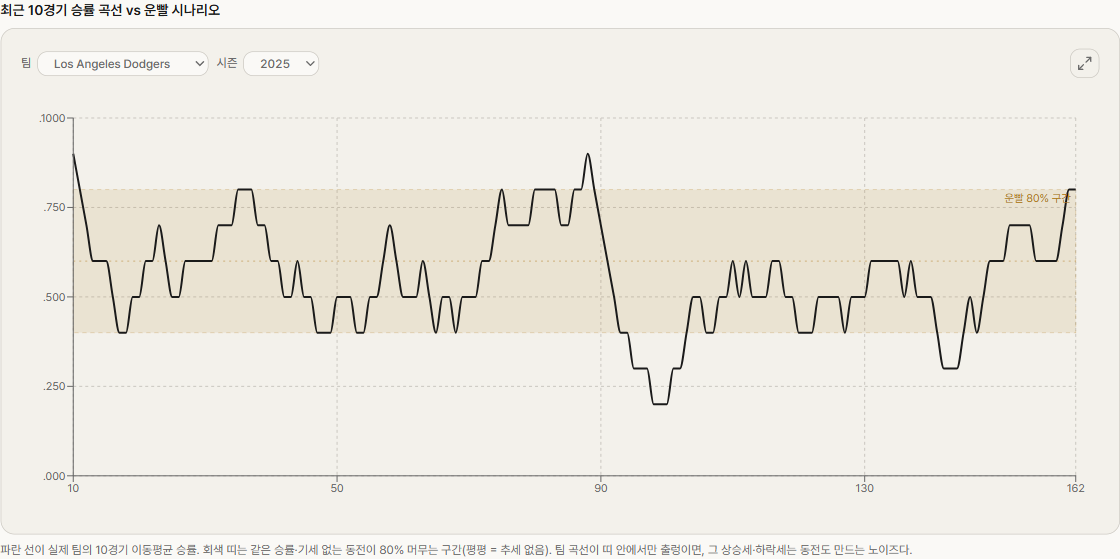
The blue line is the real team's curve. The gray band is the luck scenario — the range where a same-win-rate, momentum-free coin's 10-game rate sits 80% of the time. Notice the band is flat. A coin has no trend, so its curve wobbles up and down but on average stays at one height.
Here's the point. The real team's blue curve clearly wobbles — it spikes and sags. But most of that wobble happens inside the gray band. In other words, the peak we called an "August surge" is indistinguishable from the wobble a momentum-free coin produces too. (Try swapping teams above — most curves never stray far outside the band.)
Closing it with numbers: did winning lead to more winning?
Curves are intuitive but the eye can be fooled. Let's nail it down. If momentum were real, a team should win more right after a win. So we split win rate by the previous game's result — what statistics calls conditional win%.

Pooling all 150 team-seasons across 2021–2025:
- Win rate after a win: .516 / win rate after a loss: .485. The gap is just 3 points. If momentum were real these should split widely, but they're nearly stuck together. (Even that small gap is partly an artifact of strong teams carrying both streaks and high win rates.)
- The runs test z — which checks whether wins and losses are abnormally clustered — averages −0.15, right around zero. There's nothing you'd call clustering across the season.
- And the headline: 90% of the 150 team-seasons' longest streaks fall within the luck scenario's 90% range. Nine times out of ten, even a season's longest streak was a length a coin commonly produces.
So is nothing ever real?
No — and that's the fun of it. If 90% is luck, 10% isn't. Sort by lowest luck % and the genuine exceptions, the ones a coin can't explain, rise to the top.
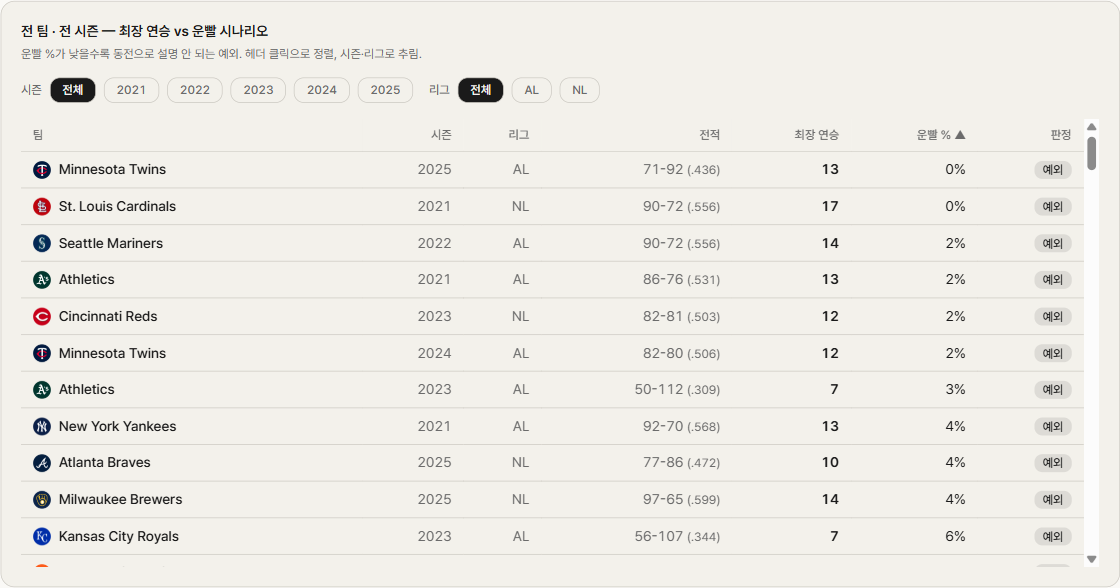
- 2021 Cardinals — 17 straight (luck 0%). A September 17-game run that grabbed a playoff spot. A same-win-rate coin barely produces it across 20,000 seasons.
- 2022 Mariners — 14 straight (luck 2%). The streak that ended a 21-year playoff drought.
- 2025 Twins — 13 straight (luck 0%). And they were a .436 losing team. A losing team's 13-game streak is nearly impossible for a coin.
These streaks were real — statistically extreme events that escape even the coin yardstick. It's the same conclusion shape as regression to the mean: most of it is luck, and the small remainder that survives the cut is the real thing.
To sum up
- To check whether an in-season streak is "real," you first ask what a momentum-free coin (the luck scenario) does at the same win rate — that's the null model
- The 2024 Yankees' 8-game streak is luck 58%, even the 2022 Dodgers' 12-gamer is 41% — even great teams' streaks are mostly what a coin does anyway
- The 10-game win% curve wobbles but mostly inside the luck band; conditional win% is .516 after a win vs .485 after a loss — barely a split
- 90% of longest streaks sit within luck's 90%. Only the 10% — the 2021 Cardinals (17), the 2022 Mariners (14) — are real exceptions
The August tear, mostly, happened in our heads. The data just shows a random peak a coin made, and the brain bolts a "they leveled up" story onto it. This isn't a baseball-only trap — a fund manager's hot streak, a gambler's "feel," an interviewer's gut: everywhere, people misread random clusters as skill.
The bridge to next time
So far we've seen that the wobble within a season is mostly luck. Which raises one more question.
Within a season it was luck. But what about the end of a season? A team that finished September on fire — does it carry that form into next April?
Between games within a season there was no memory. But a season's final month — if it reflects a settled roster and called-up prospects — might just be a signal for next season. Next time we look at whether late-season performance predicts the next season. It'll be a story about the border between in-season noise and end-of-season signal.
You can play with this analysis on the Q5 page of just-mlb, which I built myself. Swap teams and seasons to see whether the curve escapes the luck band, and sort the all-teams table by luck % to hunt down the "real exception" teams yourself.
