Does luck carry into next season: regression to the mean, and telling luck from skill
Last post ended with this question.
The 2021 Mariners (+14.8 lucky wins) — what happened in 2022? The unlucky 2023 Padres — did they bounce back in 2024?
This post in one sentence:
About 87% of a season's residual is gone by the next year. The residual is mostly luck, and luck returns to the mean the following season — that's regression to the mean.
Recalling the residual
In Q2 we defined the residual.
It's how much more (or less) a team won than its runs scored and allowed say it should have. Positive means it overperformed; negative means it underperformed.
Back then we called the residual "luck." But we quickly stepped back and admitted something.
The residual isn't all luck. It's a mix of luck + the skill the Pythagorean formula can't capture (a strong bullpen, winning close games). So how do we separate them?
This post answers that.
One trick to separate luck from skill
The core idea is a single sentence.
Luck doesn't repeat. Skill does.
Ten heads in a row doesn't make the eleventh flip more likely (luck). A .330 hitter, on the other hand, will probably hit well next year too (skill).
So if you want to know whether a residual was luck or skill, go to the next season and see if it's still there.
- A team that got lucky this year and does just as well next year → that was skill, not luck
- A team that got lucky this year and drops back to ordinary (residual 0) → that was luck
Building season pairs
To see this in data, we pair each team's consecutive seasons. One point is one team's (this year's residual, next year's residual). Call this a season pair.
Five seasons (2021–2025) give four consecutive pairs: 2021→22, 22→23, 23→24, 24→25. Four points per team, 30 teams — 120 points total.
A small but important detail: teams must be matched by team ID, not name. Cleveland changed from the Indians (2021) to the Guardians (2022); match by name and this team's 21→22 pair silently disappears. "What identifies the same entity" is always a question to settle first when working with data.
The picture: this year's residual vs next year's
Put this year's residual on the X-axis, next year's on the Y-axis, and plot all 120 team-seasons:
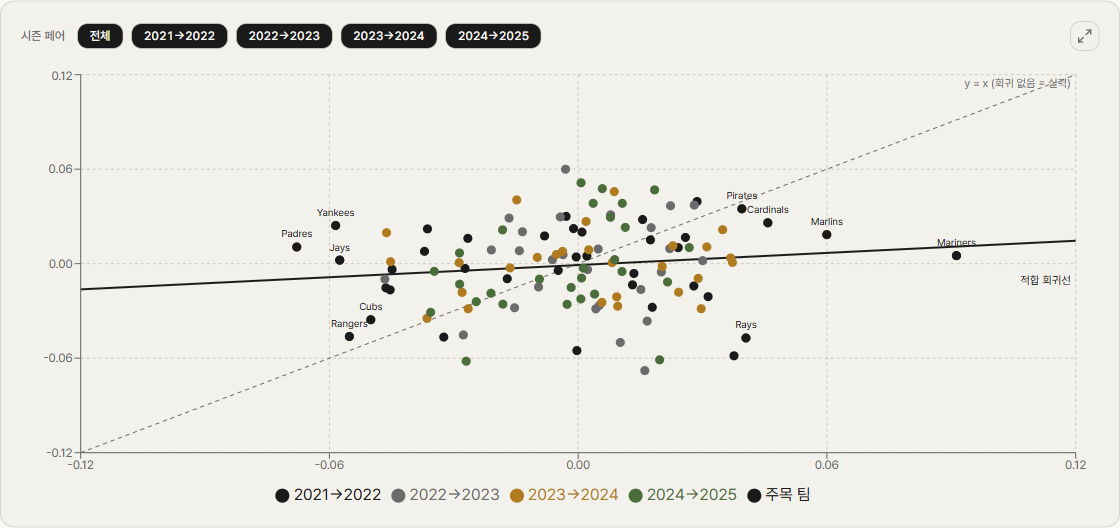
There are two lines.
- y = x (dashed): if the residual were 100% skill and persisted exactly, every point would sit on this diagonal.
- Regression line (solid): the line actually fit to the data.
The two diverge sharply. The regression line is nearly horizontal — the points don't follow y=x, they're flattened toward Y = 0. However big this year's residual was, next year it returns toward zero.
The slope is the answer
The slope b of the regression line is exactly the number we wanted: "this year's residual of 1 leaves b behind next year."

In our data, b ≈ 0.13. Only 13% of this year's residual survives into next year; the other 87% vanishes. The correlation r is also around 0.13 — nearly unrelated, meaning whether you got lucky this year is essentially independent of next year.
This is regression to the mean. The name comes from the 19th-century statistician Galton, who noticed that tall parents' children aren't as tall as the parents — "regression toward the mean," which was precisely the observation that the slope is less than 1. Our b = 0.13 falls well short of 1, and that shortfall is the amount of regression.
What happened to the Mariners and Padres
Let's track the two teams the last post left hanging.
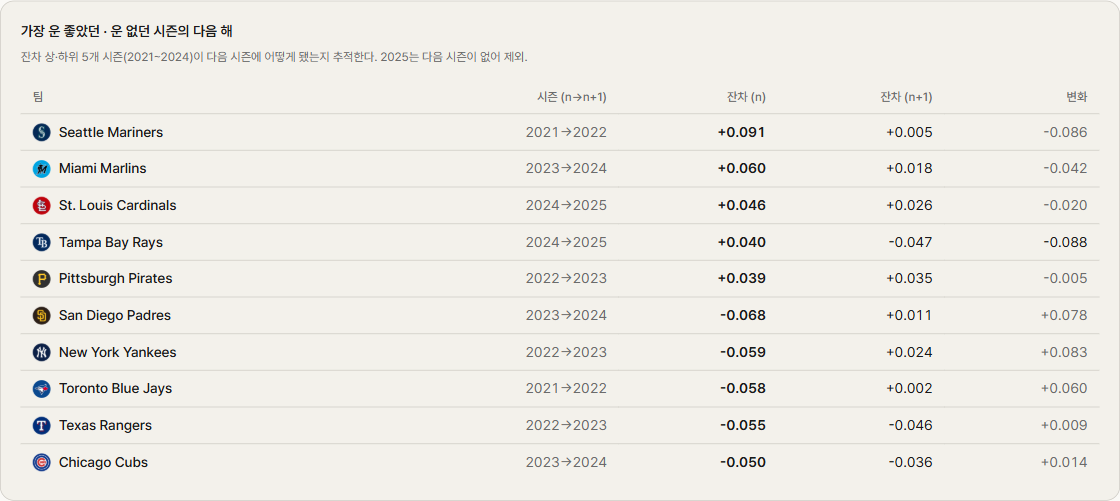
| Team | Season | Residual (that year) | → | Residual (next year) |
|---|---|---|---|---|
| Mariners | 2021 | +0.091 (+14.8 wins) | → | +0.005 |
| Padres | 2023 | −0.068 | → | +0.011 |
The Mariners' +14.8 wins evaporated almost entirely — the residual fell from 0.091 to 0.005, essentially zero. The Padres' bad luck swung past zero to slightly positive the next year. Both are textbook regression to the mean. That season's residual was that season's luck, and luck didn't follow them into the next.
So what's the 13%?
Let's be precise about one thing: b isn't exactly 0. 13% stays.
This is the part we stepped back from in Q2 — the residual isn't 100% luck but a mix of luck and skill. That small skill component (a bullpen that consistently wins close games, a manager's bench work) is the 13% that survives into the next year. Regression to the mean doesn't say "it all disappears" — it says "most of it disappears." We can't cleave luck from skill with a knife, but the data gives us the ratio: 87% to 13%.
Summing up
- We paired each team's this-year and next-year residuals into 120 season pairs
- Regression slope b ≈ 0.13 — 87% of a season's residual is gone the next season
- Both the 2021 Mariners (+0.091) and 2023 Padres (−0.068) drifted back toward 0 the year after
- The residual is mostly luck, and luck regresses to the mean. The surviving 13% is skill's share
Practically, then: don't bet a surprise overperformer to be a powerhouse next year. Most of that surplus is luck that won't repeat. And this isn't just baseball — a company with a blowout quarter, a surprisingly high test score, regression to the mean works everywhere.
A bridge to next
So far we've looked at luck between seasons. Season-to-season luck returns to the mean.
But one question remains.
What about within a season? Is the surge of "a team that caught fire in August" real, or is that luck too?
Next post we slice a single season into games and ask whether winning streaks and hot stretches are statistically meaningful. A coin produces seven heads in a row too — so how is a baseball team's August tear any different? It'll be the post where we first reach for a new tool: time series.
This analysis is on the Q4 page of just-mlb, a tool I built. You can see how far the y=x line and the regression line diverge, and toggle season pairs one at a time with the chips — smaller samples show how the slope wobbles.
