Is exponent 2.0 actually optimal? Where 1.83 came from, and overfitting
Last post ended with this question.
Is 2.0 actually the right exponent? Can we find the real best from the data?
Bill James used RS² / (RS² + RA²), and we saw it fit our 5 seasons well. But why squared? The exponent was chosen because it fit well in practice. Some baseball analysts use 1.83 instead. Who's right?
This post in one sentence:
2.0 is a bit too high, 1.83 is reasonable, and on our 5-season data the best is 1.71. But the differences are about 0.1–0.4 wins per season — practically nothing.
The exponent is a number we get to choose
First, a concept. The Pythagorean expectation generalizes to:
Bill James fixed k = 2, but that 2 isn't fixed by anything. We get to pick it. In data analysis, a number we set ourselves inside a model is called a hyperparameter. The shape of the formula is fixed, and we tune the one number inside it.
In machine learning, hyperparameters show up all the time — learning rate, regularization strength, tree depth. The essence is the same. A degree of freedom no one else has set, so we have to look at the data and decide.
So the next question is this. Sweep k from 1.5 to 2.5 in 0.01 steps and find which value best fits actual win rates.
What do we mean by "best fits"
We already picked our answer last post. MAE — Mean Absolute Error.
The average absolute difference between each team's actual win rate and the Pythagorean prediction. Multiply by 162 and you get "how many wins off, on average, the prediction is."
Same reason as last post — r barely moves between 0.9503 and 0.9511, but MAE gives a direct answer to "did this drop from 3.5 wins off to 3.0 wins off?"
When you're comparing different models against each other, an error metric like MAE is cleaner than r.
Drawing the curve
We tested all 101 values of k from 1.50 to 2.50, computing MAE across all 5 seasons (150 teams) at each value. Plot k on the x-axis and MAE on the y-axis:
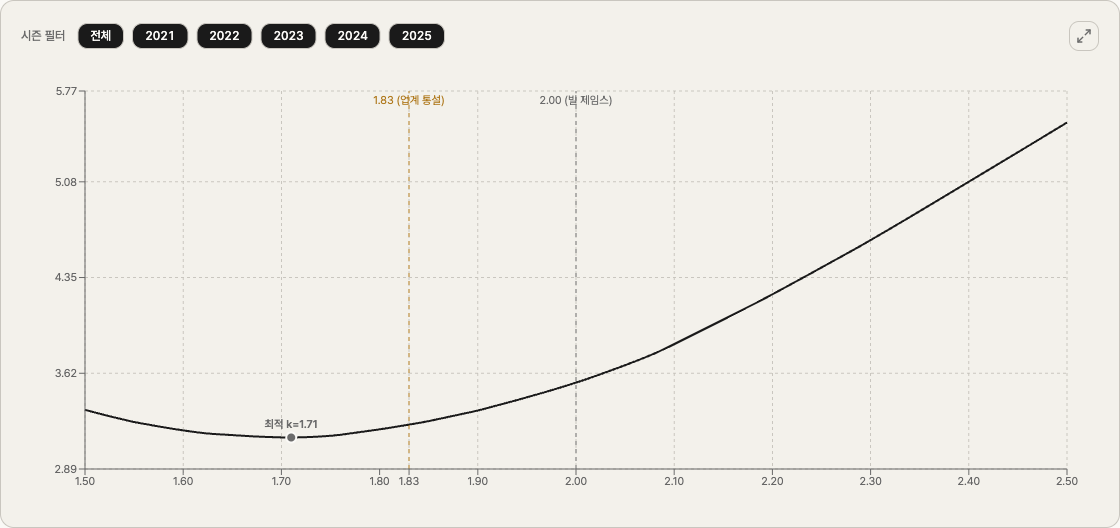
The shape is clean. It drops on the left, hits a floor somewhere in the middle, then climbs again. A U-shaped curve, convex downward.
The bottom of that U is the optimum our data points to. It sits at k = 1.71.
At that k, MAE is 0.01932 — about 3.13 wins per season. Bill James' 2.00 lands at 3.55 wins; the industry-standard 1.83 lands at 3.23. Side by side:

| Exponent | MAE (wins) | Vs. optimum |
|---|---|---|
| Data optimum 1.71 | 3.13 | — |
| Industry 1.83 | 3.23 | +0.10 wins |
| Bill James 2.00 | 3.55 | +0.42 wins |
Read literally: "1.71 is best, 2.00 misses by 0.42 wins more." But 0.42 wins is the gap in average per-team error per season. Across 162 games, that's almost noise.
The 1.83 vs 1.71 gap of 0.10 wins is even smaller. Practically interchangeable.
Where 1.83 comes from
1.83 is known as the most accurate single exponent, and it's the value Baseball-Reference uses for expected win percentage. It became the standard from the same kind of comparison this post does, run on far more seasons than ours.
Which means our 1.71 from 5 seasons isn't a "discovery" either. The optimum drifts as the data sample changes. 1.83 comes from a long history of seasons; our 1.71 came from 5.
Which raises the next question.
What about a single season — how much would the optimum shift if we only used 30 teams?
One season at a time — 1.57 through 1.76
If 1.71 is the answer when we pool 5 seasons, what happens if we re-run the sweep on each individual season (30 teams)?
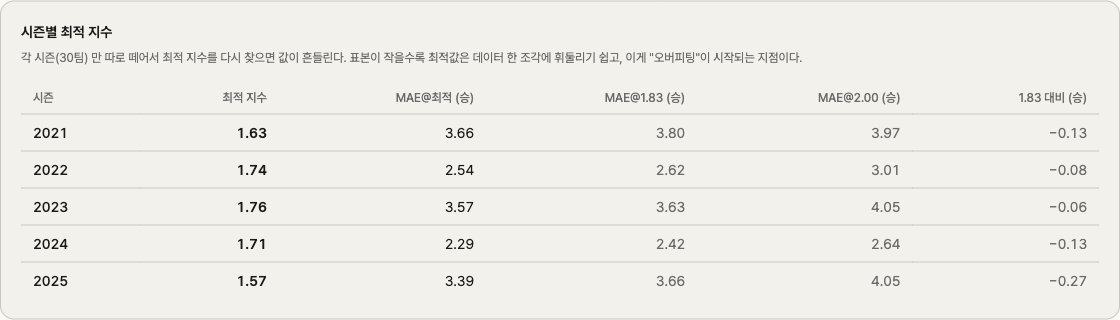
| Season | Optimum k |
|---|---|
| 2021 | 1.63 |
| 2022 | 1.74 |
| 2023 | 1.76 |
| 2024 | 1.71 |
| 2025 | 1.57 |
A range of 1.57 to 1.76. A spread of 0.19. The mean is around 1.68, close to the pooled 1.71.
Why does it move season to season? Each season is 30 teams. Statistically, that's a small sample. The randomness inside it — who happened to win a lot of one-run games, who slumped in August and recovered in September — sways "the optimum for that season."
This is a small example of a basic concept in data analysis. Overfitting.
Overfitting — when a model "memorizes"
Overfitting in one sentence:
A model that has memorized the random noise in the data, not just the underlying pattern.
Each season's optimum k fits that season's MAE perfectly. Use k = 1.57 on the 2025 30-team set, and you get the lowest possible MAE for 2025. But take that 1.57 and apply it to 2024? It does worse than 2024's own optimum (1.71). 1.57 has memorized 2025's randomness, and that randomness doesn't repeat next year.
You run into this often in data analysis.
- A retail sales model with 12 variables that hits r² = 0.99 — it might just be memorizing last year's revenue
- A machine learning model with 99.9% training accuracy that drops to 60% on new data — memorized
- Our case here, where each season's optimum k differs — likely fitting season-specific noise
The simplest cure for overfitting is "tune less." If our per-season optima range from 1.57 to 1.76, don't lock in one season's value; use a value that works across seasons. 1.83 sits a little above our per-season range, but it comes from a much longer stretch of data, so it's less swayed by any single season's noise.
A sensible value often does better on new data than one tuned all the way.
Summing up
- Swept k in the Pythagorean formula from 1.50 to 2.50
- Our 5-season data points to k = 1.71 as the optimum
- That's 0.42 wins better than James' 2.00 and 0.10 wins better than the industry's 1.83
- Per-season optima drift between 1.57 and 1.76 — the limit of small samples
- So a sensible value from long-run data, like 1.83, is a safer pick than one season's optimum — one way to avoid overfitting
This post introduced two concepts: hyperparameter and overfitting.
Next time
Last post left a thread hanging.
A residual of +0.091 isn't all luck. Some of it is skill, some is luck. How do we tell them apart?
We can't answer it directly. But the next season gives us a hint. If a team got truly lucky in one season, it should regress next year. If what looked like luck was actually skill, it should show up the same way again.
The 2021 Mariners (+14.8 wins, residual +0.091) — what happened in 2022? The 2023 Padres (−11 wins) — did they recover in 2024?
Next post is on regression to the mean. We'll check it with data and look at how to separate luck from skill.
This analysis is on the Q3 page of just-mlb, a tool I built. You can play with the MAE curve and the per-season table directly — and toggle individual seasons with the season-filter chips to see how the curve shifts.

